Flu Season in the US Analysis for Medical Staffing Agency.
-
Background.
A medical staffing agency needs help to plan for the upcoming influenza season. In order to achieve this goal, the agency requires a data analyst to examine influenza trends and provide insights on influenza season in the United States.
-
Context.
This project was completed as part of the CareerFoundry's curriculum.
Topics covered were translating business requirements; cleaning, integrating, and transforming datasets in Excel; conducting statistical hypothesis testing in Excel; using visual analysis and forecasting in Tableau; and presenting results to an audience by incorporating storytelling techniques.
This knowledge was used to help a fictional medical staffing agency prepare for an upcoming flu season in the United States.
-
Tools.
Excel - a software application that allows the spreadsheets and their contents to be manipulated.
Tableau - software for data visualization.
The Path to Planning for Influenza Season.
Created a project management plan for stakeholders to outline the process to achieve business requirements.
Provided transparency to stakeholders on project goals.
Included information about stakeholder communication, schedule/milestones, deliverables, and audience.
Guided the process for the rest of the project.
Image by Jazmin Quaynor
2. Formulated a research hypothesis for the project.
Supported which areas of the data sets should be investigated in more detail in a later step.
3. Summarized information about potential datasets to be used for the analysis, including: relevance, source, collection method, potential biases, limitations, and data profile information.
Decided which datasets would be sufficient to fulfill the needs of testing the project hypothesis.
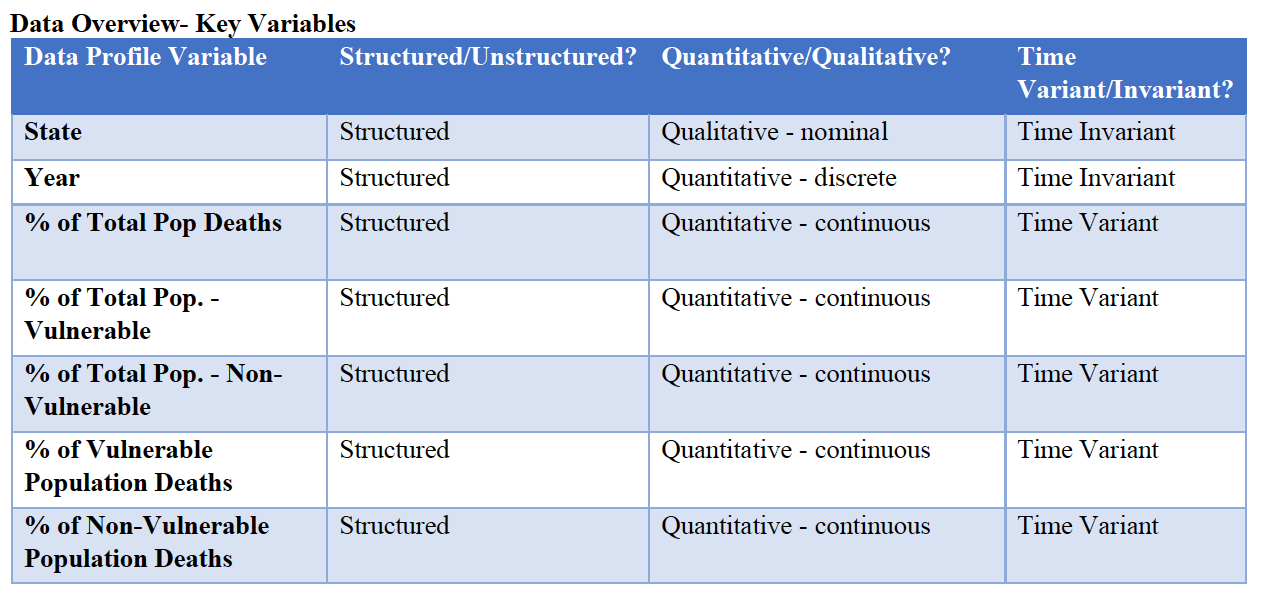
Data profiles for key variables.
Check for missing values in the influenza deaths data set.
4. Cleaned data by addressing any consistency, accuracy, and missing value issues.
Determined how best to deal with consistency and missing value issues.
Ensured future analysis and values derived from these variable were accurate.
5. Integrated and transformed datasets in Excel.
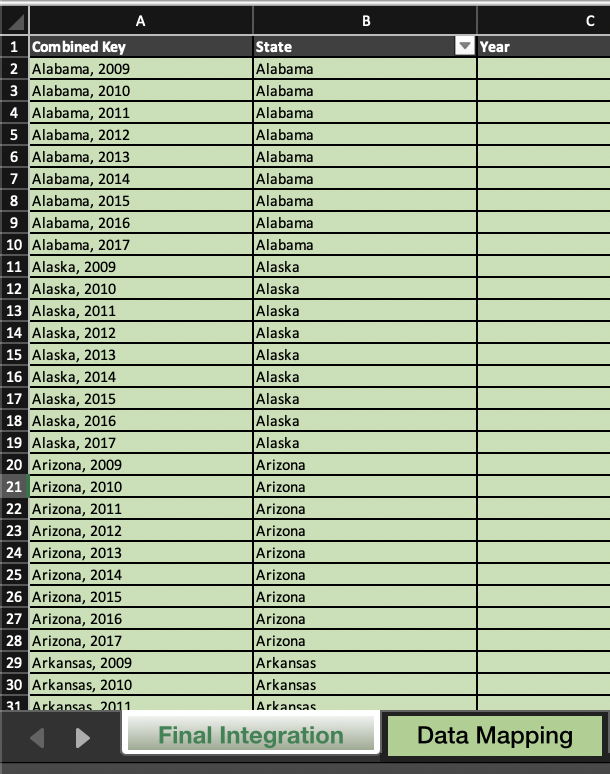
Allowed variables from multiple datasets to be referenced in one document and create new variables from these columns.
Snippet of integrated and transformed dataset.
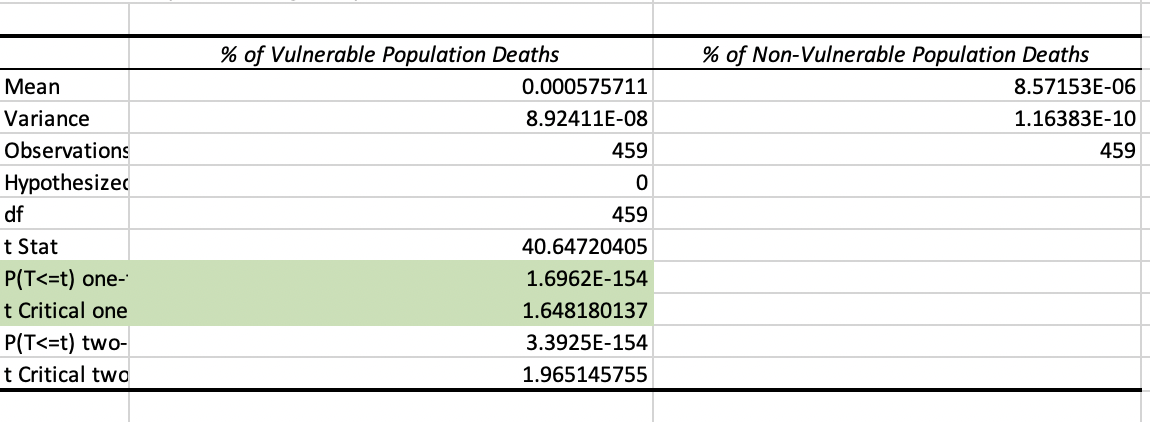
Two-sample t-test assuming unequal variances.
6. Conducted statistical analyses and statistical hypothesis testing.
Picked which variables to conduct statistical hypothesis on.
Rejected the null hypothesis using a one-tailed t-test.
7. Prepared an interim report documenting analytical insights for stakeholders.
Chose how to summarize and format information in the report.
Image by Beatriz Pérez Moya.
Example of a visualization created in Tableau.
8. Created visualizations for data in Tableau.
Decided which types of charts should be created and how they should be formatted to best present information.
9. Developed a presentation for stakeholders based off of a Tableau Storyboard.
Implemented the art of storytelling to keep audience engaged in the presentation.
Selected images, charts, and colors for storyboard to create a cohesive presentation.
Story points from Tableau Storyboard.
Key Findings.
An average of 46,158 people died from influenza deaths each year from 2009 to 2017 in the US. 46,197 more influenza-related deaths are forecasted for 2018, if protective action is not taken.
From 2009-2017, the average annual influenza death rate for the vulnerable population was 0.059%, which is more than five times the influenza death rate for the non-vulnerable population.
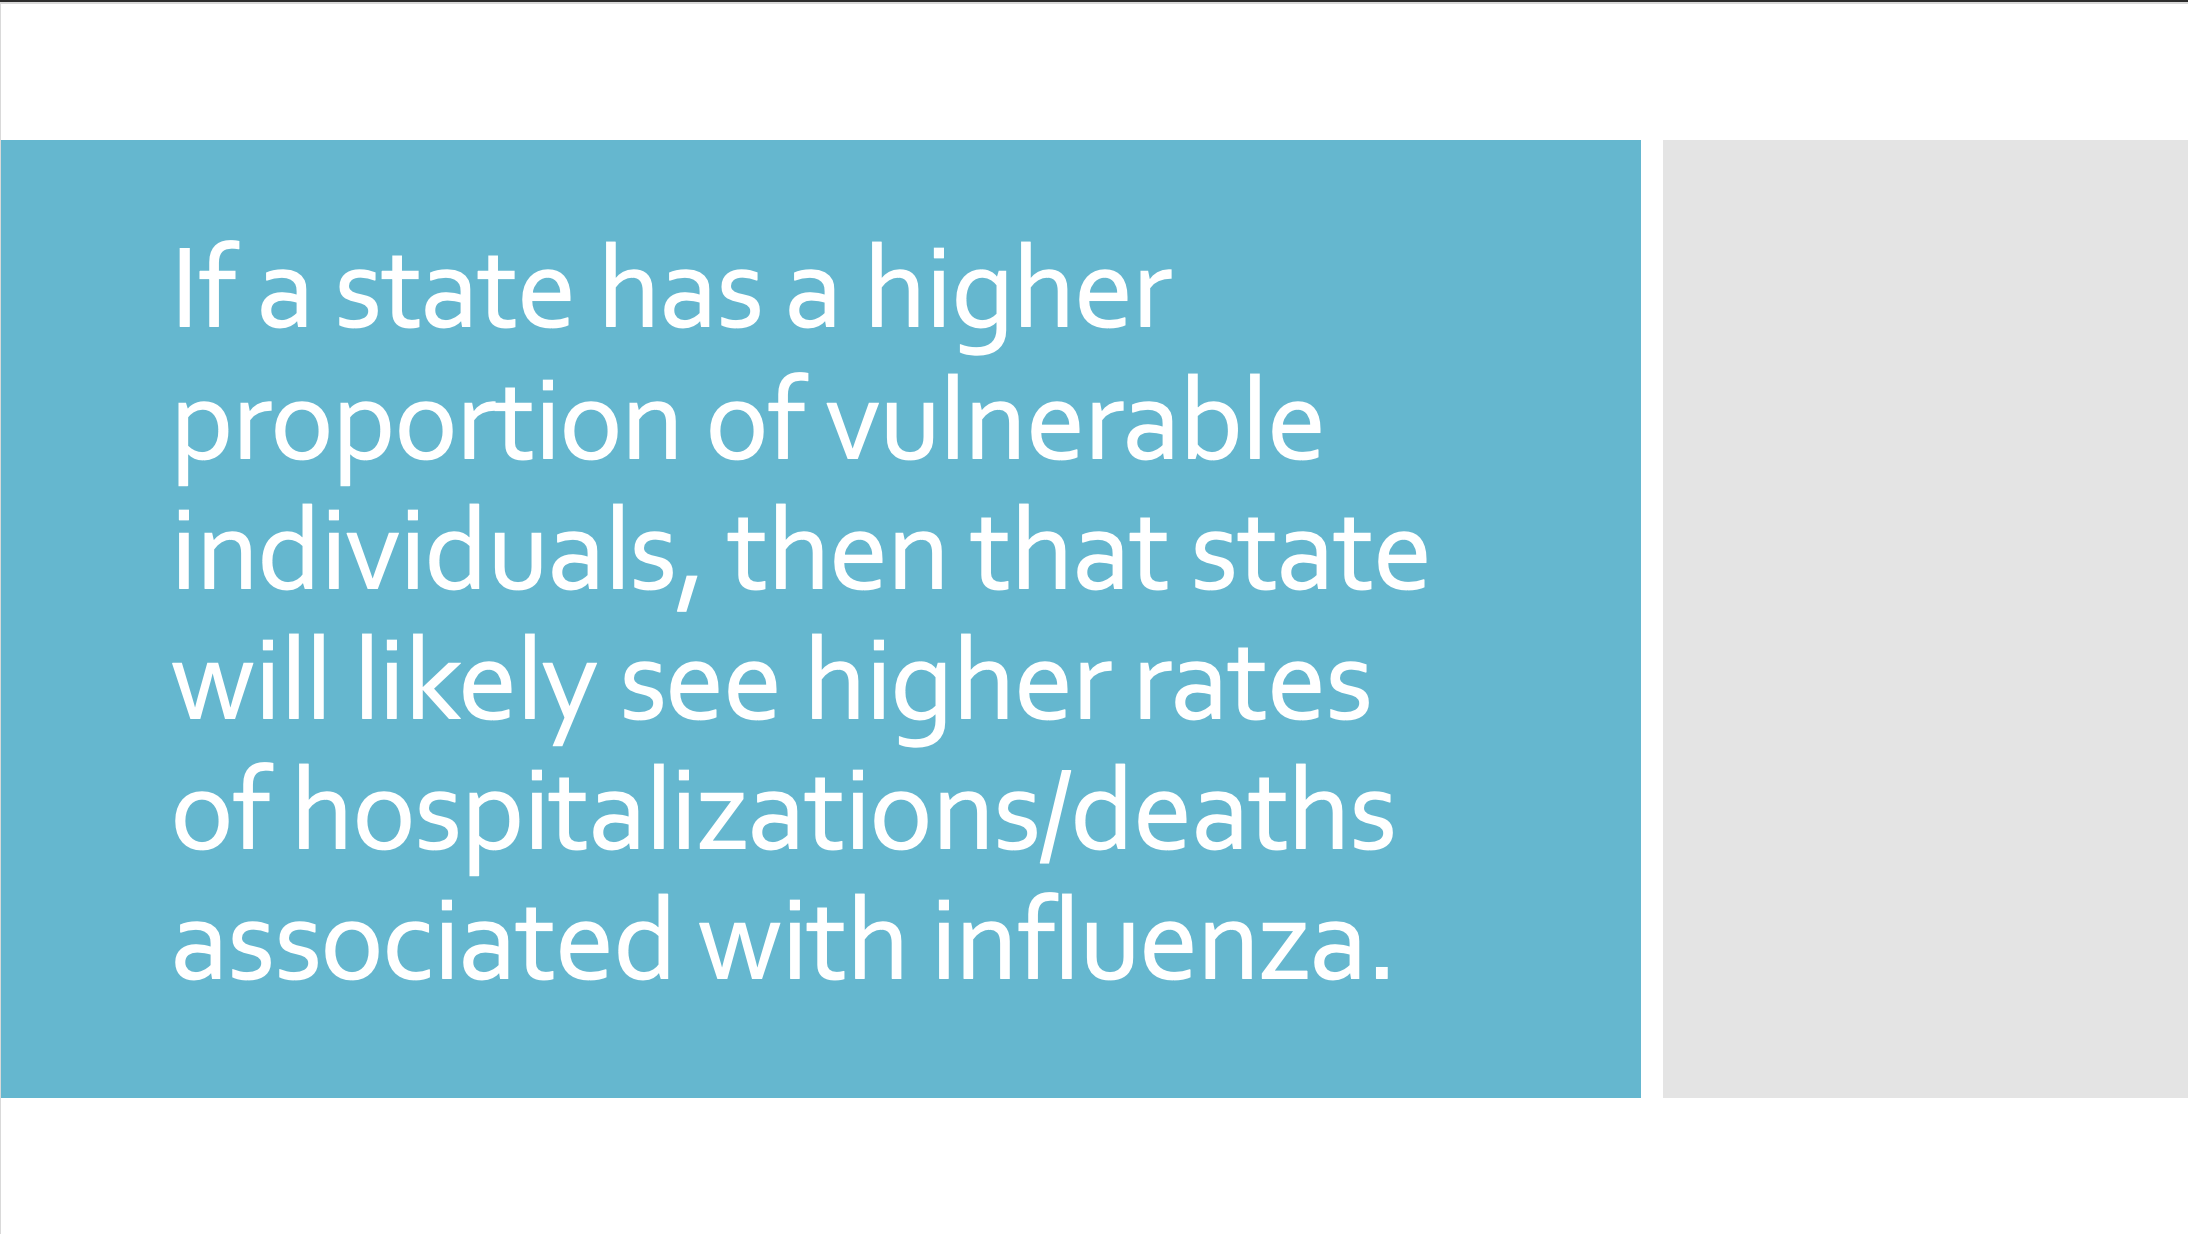
If a state has a higher proportion of vulnerable individuals, then that state will likely see higher rates of hospitalizations/deaths associated with influenza.
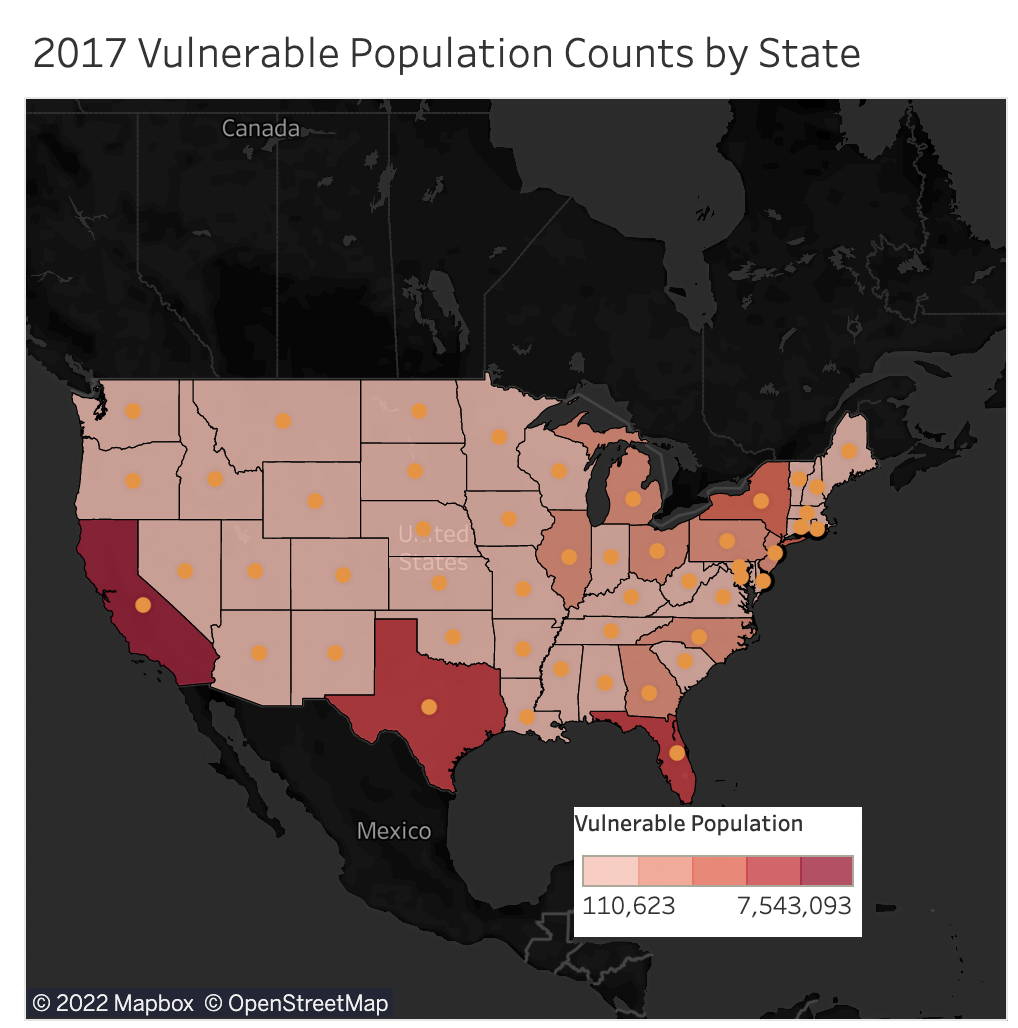
California, Florida, Texas, and New York have the highest vulnerable populations, with counts over 4 million. As a larger vulnerable population count suggests a state will have a higher number of influenza deaths in the coming season, they should be prioritized in receiving additional medical staffing.
Deliverables.
-

Stakeholder Interim Report
-

Stakeholder Final Presentation
-

Tableau Storyboard.
Next Step.
While the above information fulfills the requirements of the project, the next step would be providing support implementing and monitoring staffing plan for the upcoming flu season.

